The Sysinternals suite is a toolkit that can be downloaded for free from the Microsoft website. Really all of the included tools (of the many I tried so far) are very helpful for specific purposes and it does not come as a surprise that Microsoft bought the previously independent company “Winternals” years ago.
For my work as Security Consultant I also like to recommend these tools to my clients because the software is self-contained, i.e. it runs without installation. Moreover, it comes from a trusted source (Microsoft) and does not require too much training.
Fun fact: The original developer of Sysinternals – Mark Russinovich – is now CTO for Microsoft Azure. Apparently someone with a strong technical background in this C-level position.
Process Explorer and Process Monitor are two software solutions from the Sysinternals bundle which allow to look very deeply into what is happening in your Windows system. For hardcode forensics you would probably want to use other tools. Also for system scanning, there are many other tools, for example LOKI IoC Scanner, but for a quick start and a straightforward user experience, Process Explorer and Process Monitor are a good choice to get a quick understanding of what certain software is doing on your system.
Mark Russinovich calls Process Explorer a “Super Task Manager” because of it’s great functionality to analyze processes and threads. Process Monitor on the other hand is something what I would call “SIEM for processes” because it shows in realtime all system activity (files, registry, network, processes and threads) and allows to filter and search for “threats in the threads”. Especially in situations where clients got a SIEM alert that a workstation communicated with a malicious website but then cannot find anything suspicious on the system itself, I recommend to run Process Explorer and Process Monitor to find out more about the threads running on the system and to see which program is responsible for the potentially malicious connection attempts. You should however always keep in mind that you might be dealing with some kind of virus or malware that hides from Process Explorer and Process Monitor or that circumvents detection by manipulating the system on kernel level.
By the way, if you are interested in a real-world example, I can recommend Mark Russinovich’s (slightly dated) series (part 1, part 2, part 3) on analyzing Stuxnet with Sysinternals.
In this blog post I just want to explain some useful tricks and features that I use most often when working with Process Explorer. I will write another post on best practices for Process Monitor. In fact, I do not only use these tools to identify potential malware. They are also very helpful for tuning firewall rules and software restriction policies (SRP), because if some process lacks required permissions, you can see immediately where adjustments are needed. Does the program spawn another executable which is not whitelisted in my firewall rules or SRPs? Does it try to access a folder which I did not grant permissions for? Which program is making my system so slow? A brief look into Process Explorer and Process Manager can answer such and many more questions.
Some definitions
As Windows expert David Solomon points out,what is actually running on your system are not processes, but threads inside these processes:
Process
Instance of a running program. Components:
• Address space – shared among threads (see below)
• Open handles (can be analyzed with PE/PM)
• Security token (can be analyzed with PE/PM)
Threads
Execution context within a process. Threads run, not processes!
• Every process starts with one thread (runs “main” program)
• Thread can create other threads
Why not Task Manager?
So, if I want to see programs running on my system, why can I not simply press Ctrl-Alt-Del and start up Task Manager which is shipped with every Windows system?
This is a valid question, especially because Task Manager considerably improved over the last years. While in earlier versions it showed “some windows of the current session”, it now even provides some details on what is running in multi-purpose processes like svchost.exe. Before it looked like this:
svchost.exe
svchost.exe
svchost.exe
But in current versions it actually goes the extra step and displays the specific service running in this “service container”, e.g.
Service Host: Windows Event Log
Service Host: Network Store Interface Service
Service Host: Local Service
Newer versions of Task Manager will also show the command line parameters with which a program was started, allow you to search online for a specific process (a feature which, I think, they took from Process Explorer), to launch useful other applications like services.msc, and to group services per user session. For a good understanding on what exactly each process is doing, this information is however still not enough.
Process Explorer
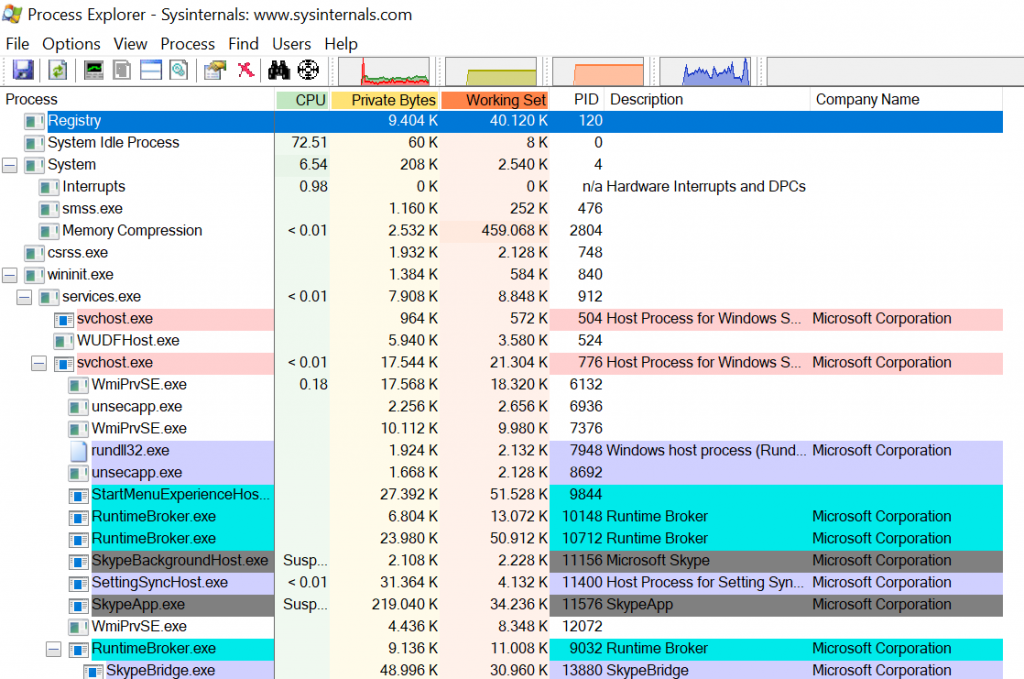
When you start Process Explorer for the first time, the interface might seem overwhelming. But while it does pack a lot of information into one screen, you will quickly learn to appreciate how much can be understood with just one look. Actually, the sheer amount of different numeric values can be intimidating, but as long as you are not trying to track down some resource bottleneck, you can pretty much ignore all of these.
The next difference that is very apparent when compared to Task Manager are the different colors. You can see what each of them means by clicking on Options – Configure Colors…
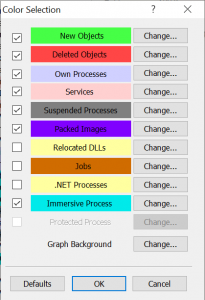
Look out for: Packed Images
For your threat hunting endeavour you will be most interested in “Packed Images”. They will usually not be present on your system. If they are, it can have a legitimate reason, but also malware uses this technique to hide strings which otherwise could reveal them to antivirus software. You will also want to see when a new program starts up (“New Objects”) and when it terminates (“Deleted Objects”). Oh and “Immersive Process” shows that Process Explorer does belong to Microsoft – it is the marketing-friendly term for applications that use newer Windows APIs.
While color-coding allows to add one more layer of information to the screen, it is not multi-dimensional, i.e. if you select too many of the possible categories and if one process falls into several categories, it will still be shown in only one of the colors. This means that you should think twice before simply selecting everything in this dialogue. Also, the default duration to show changes is quite short. For example, a new process will be highlighted in bright green, but only for one second. If you want to make things a bit more visible, you should increase this value under Options – Difference Highlight Duration… The maximum are nine seconds. You can also freeze the current display by pressing the Space bar (or choose View – Update Speed – Paused). Hitting once more reverts the program back to realtime monitoring. If you want Process Explorer to automatically jump to new processes as they come up, you can select the option View – Scroll to New Processes.
Look out for: VirusTotal matches
The next thing you will want to look is if some of the programs running in your system are known to be malicious. Therefore, Process Explorer contains an integration with VirusTotal.com. While you will probably only have one antivirus software running on your system, VirusTotal uses over 70 different AV solutions to check your programs. Even if your local protection did not find a threat, VirusTotal might well do.
When you click on Options – VirusTotal.com – Check Virustotal.com, you will first have to agree to the terms and conditions.
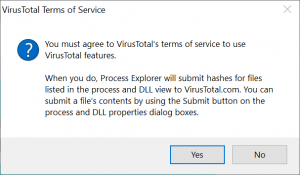
After you click “Yes”, a new column in Process Explorer will show, how many of the scan engines said that a particular program running on your system is malicious.
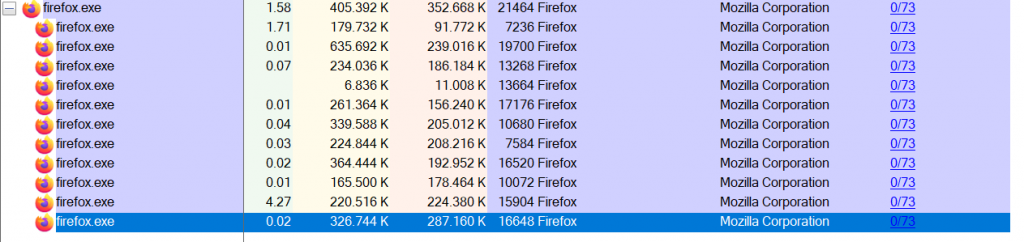
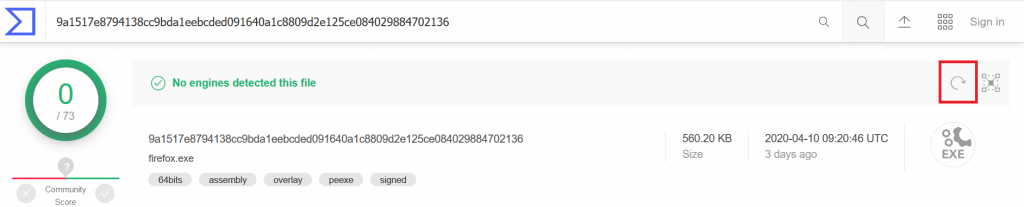
A value of “0/73” means that none of the 73 engines reported the process as malicious. Also on clean systems you will see values greater than 0, because AV software is not perfect and might report false positives. Everything greater than 2 or 3 however is concerning and should be looked at more closely. If you click on the VirusTotal value, Process Explorer opens the website for you and shows the scanning results. Since the service does not run the scan engines every time a user performs a check, it can be that some AV engines received signature updates since the last time they scanned the file and would now report it as malicious. If in doubt you should therefore make us of the “reanalyze file” button on the upper right corner of the VirusTotal website to enforce a current scan:
Also note that Process Explorer can calculate hashes for all running processes including system processes if it is running with admin privileges. You can do so by clicking on File – Show Details for all Processes. Also for most forthcoming features, admin rights will lead to more information.
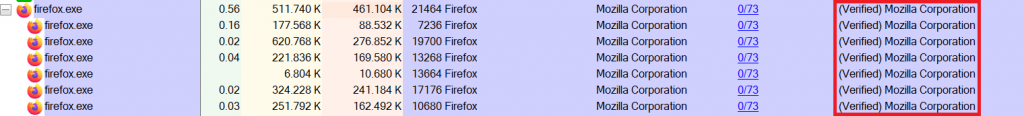
Look out for: Verified Signer
Most major software vendors will use Code Signing to proof that a program is really from them. For example, technically nobody can stop you from writing a program, call it firefox.exe and write “Mozilla Corporation” in the developer field, even if your program has nothing to do with the original browser. Of course, malware developers use this technique to hide behind well-known names and use names of prevalent system services such as svchost.exe. When you click on Options – Verify Image Signatures, a new Column “Verified Signer” will appear. If a program cannot be verified, you should check online if this is normal. Maybe the author simply did not use code signing, but especially if this occurs with a well-known program, you should be suspicious. A Windows explorer.exe that is not digitally signed? Not good. Be aware however that even if you do see a “Verified” message, malware could still hijack that legitimate process, e.g. by launching it with specific parameters to execute malicious third-party code. For this you could for example check the “Command Line” option with which the process was started.
Look out for: Image path
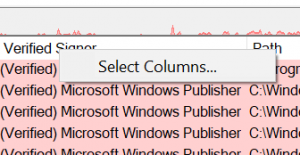
Another indicator that something on your system is not quite right is if a program is installed in a path where you would not expect it. For example, if you know that the original svchost.exe from Microsoft is only running in C:\Windows\System32, alarm bells should ring if an equally named program suddenly was found to be stored in another path. Process Explorer can show these file locations: Just rightclick on the column headers and choose “Select Columns”…
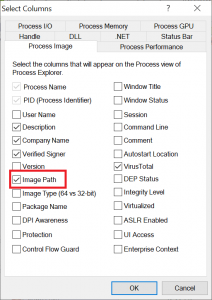
In the following dialogue under the “Process Image” tab, select “Image Path”:
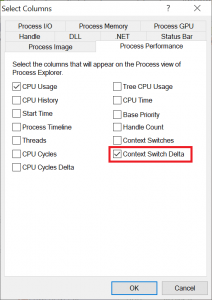
Look out for: Context Switch Delta
Both, Task Manager and Process Explorer show how much CPU performance a certain process is using up. The way this works is that the system is looking in regular intervals which program is being executed at that particular moment. Usually this check happens every 15.6ms, i.e. 1s*1000/15.6=64 times a second. You can check yourself how often your system will perform these checks by running another Sysinternals tools called ClockRes. There is also some very good explanation out there how to use it. Now, if a program manages to run in between these “test points”, it will be shown with a CPU usage of 0%. This is of course not true, so for a better understanding of which programs are most active on your system (and might be causing performance issues) you can use a more accurate metric called the “Context Switch Delta”: It will show you how many times a specific task has been switched to (and run) in between the CPU measurement interval, i.e. for how many so-called context switches it was responsible. So, rather than sorting for CPU performance, you will want to see the processes with a high Context Switch Delta on top for further scrutiny. Rightclick anywhere on the column headers and select “Context Switch Delta” from the “Process Performance” tab:
You can then move the column to the front via drag and drop and click on it for sorting:
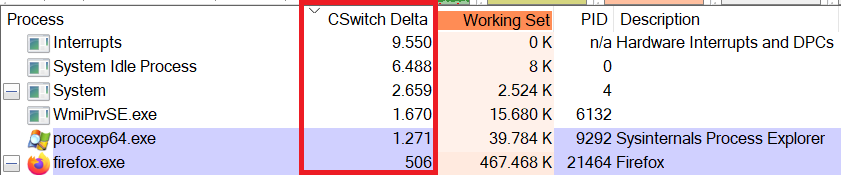
By the way, the “Interrupts” process is not an actual process but a fake entry used by Process Explorer to display hardware interrupts and deferred procedure calls (DPCs). Although this “process” does have a “C Switch Delta” entry, the value there is actually not counting context switches, but interrupts and DPCs. If you move your mouse around quickly, you will see how the CSwitch Delta value for “Interrupts” also increases, because your mouse driver is issuing more DPCs to allow smooth user interaction. If the CSwitch Delta value for “Interrupts” is constantly higher than usual, you might be dealing with buggy drivers, malicious software – or both. Of course, knowing what is a “normal” value can be difficult if the system you are analyzing is not your own.
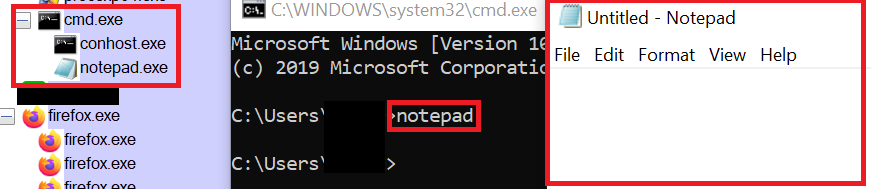
Look out for: Process Hierarchy
As you might have noticed by now, Process Explorer displays processes in hierarchical order, i.e. if one process spawns another one, that second process will appear below and indented. For example, if you run the command line tool cmd.exe and from there you start notepad.exe, that notepad will be shown below cmd.exe, i.e. the command line is notepad’s parent process. Now, if you see a program which as a parent process has, let’s say Internet Explorer, you should be at least wondering if Internet Explorer usually is the origin of that specific process, or if you are looking at some kind of malware that used a browser vulnerability to get executed.
Tip: If Process Explorer only shows you a “flat” hierarchy, you can make increase visibility by selecting the option View – Show Process Tree.
Look out for: Comments
You can add another column to Process Explorer called “Comments”. At the beginning this column will be empty for every process, but if you really want to keep track of what is going on in your system, you can analyze each process and then leave a comment, e.g. “13/04/2020: Notepad.exe in original MS version.” Process Explorer will save your comments for each program and restore them the next time you are running it. So, if at some point you see a process without comment, you know that this is something new you should have a closer look at. Now, to be totally honest, I think this is a very time-consuming task and will therefore probably almost never done. But it is good to know how the comment feature works and that your text will stay permanently. Therefore, you can also use it the other way round and mark such programs where a closer look at a later point would be advisable.
Look out for: Strings
Remember what we said about Packed Images? They can hide strings that would otherwise be potential warning signs for AV software. Process Explorer allows to show strings that come with an executable, and it also shows strings loaded in memory – this means that even for packed images, you can still see the decoded strings. Obviously, this is only possible because the program is already running, anyway. So, while you would not want to run potential malware on your system (without sandboxing it) just to check out the in-memory strings, it is useful if you are analyzing a system that already behaves suspiciously, anyway. To see included strings, double-click on the process of interest and open the “Strings” tab. If you are dealing with a packed image, you will want to select the “Memory” option to see what is actually loaded by the executed program:
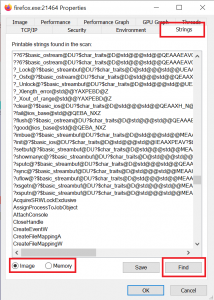
Most of the data will look like gibberish, but you can find some very useful details like key tokens, libraries, messages to be displayed (“pay us 5000$ ransom” would be a bad sign ;-)), URLs the software wants to communicate with, etc. A nice example would be the popular messaging software Slack, which uses the Electron framework where some parts are written in an interpreted scripting language like Python: Here you will have whole source code blocks displayed, ready to be analyzed. You can search for specific strings like typical URL patterns by clicking on the “Find” button or pressing Ctrl-F and then F3 to move on to the next finding.
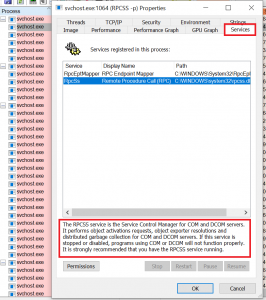
Look out for: Service descriptions
As I explained at the beginning, the normal Windows Task Manager did improve in newer versions, because it now does not only show the name of the host process of a multipurpose host like svchost.exe, but it also shows the name of which particular service is being hosted in a specific instance. However, names are often cryptic and so a name alone will not help you much in understanding what is going on in such a multipurpose container. In Process Explorer, you actually get a much more detailed description on what a service is doing. If there is no description at all, you might want to have a closer look and check if something is hiding inside a usually trusted container like svchost.exe:
Look out for: Handles and DLLs
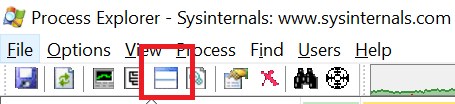
When software wants to access files on your system, read or write a registry key, establish a network connection, or basically build any kind of connection with its surrounding infrastructure, it will need to get a so-called “handle” on it. Process Explorer can show all handles currently held by a process. You can display all of these by clicking on the “Show Lower Pane” button:
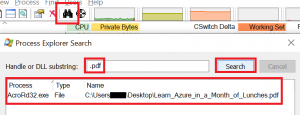
Whenever a new handle will be created, it will appear in green (or whatever color you chose for new objects), when a handle is closed, it will be shown in red. If you see “only red”, it could indicate that the software is not releasing any handles and could cause be causing performance issues. In the lower pane you can check if the process is keeping handles on files or registry keys you would not expect, or you do not want. By the way, pressing Ctrl-F in the main screen or clicking on the binoculars icon will allow you to search for handles and DLLs. This is also useful if you are trying to delete a file, but Windows tells you that it cannot be deleted because it is still in use by some other process. In newer versions of Windows, it will even sometimes tell you which program keeps a handle on it, but not always. In Process Explorer you just search for the file name and you will directly be guided to the culprit:
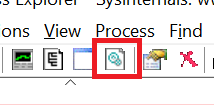
When you are done with analyzing handles, you can continue with DLLs. To do so, just click on the icon next to the “Show Lower Pane” button, which will let you toggle between handle and DLL view:
Look out for: Self-restarting apps
What Mark Russinovich calls “back your buddy” software is a simple trick that a program can use to make it restart itself immediately after you killed it. This basically means that a program is starting up twice and both instances are watching each other. Whenever you kill one instance, the other one that is still running will spawn a new instance and you will not be able to finally kill this program. Now, this is certainly a very outdated trick for malware to gain persistence, but I still wanted to have it mentioned, because Process Explorer has a neat “Suspend” feature that is also helpful for troubleshooting. So, what you will do is to rightlick on the unwanted process and click “Suspend”. All activity will then be frozen, but for the second instance that is just checking if a process with that name is there, it will still appear to be properly running. You then also suspend the second instance. At this point, both “watchdogs” are asleep, and you can simply remove both processes one after another.
What about Threads?
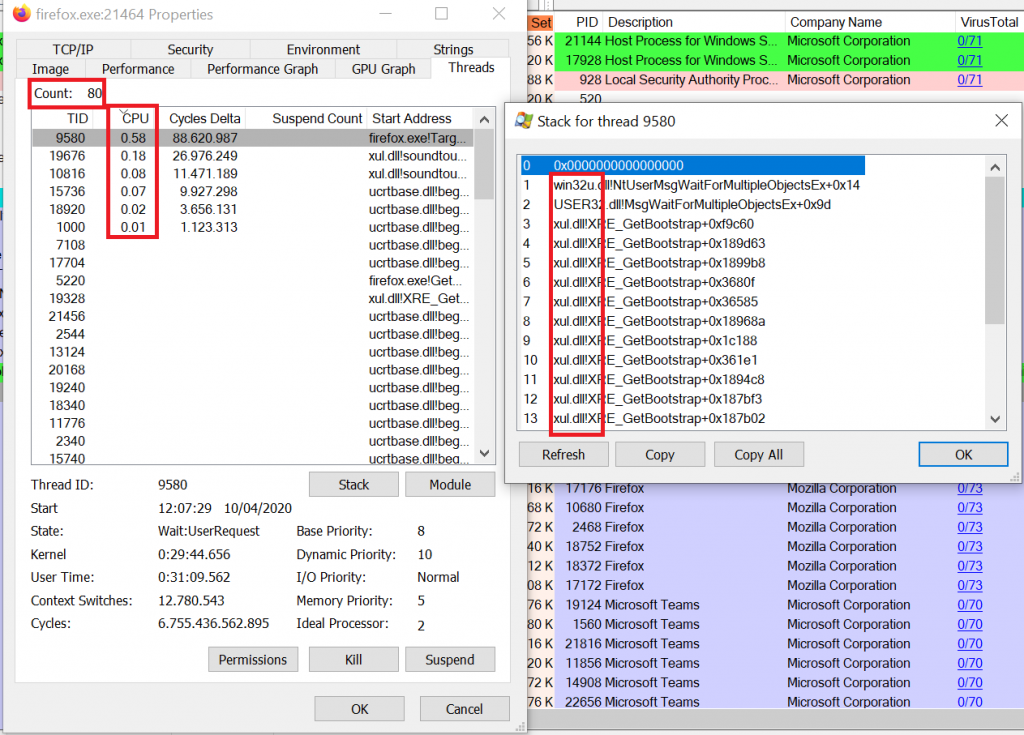
So, since I used the wordplay threa[d|t] analysis in the title, you might wonder when I finally talk about threads. To be honest, for highlevel program analysis you might not need to look into the call stack of the different process threads. But if you need, you can do so very easily with Process Explorer. Just double-click on any process and go to the tab “Threads”. There you will see all threads running in that process. You can even see the whole stack trace, i.e. the point from where the thread started and how it wandered all the way to where it is now. You can then see how much CPU performance is being used up by each thread (revealing the hungry ones) and also which DLLs were involved. Note however, that you might want to install the Windows debugging tools and configure sysmbols in Process Explorer if you plan to delve deeper into the stack trace.
In a future post I will explain how to use Process Monitor to see what is going on in a running system. Good luck with your analysis!