As I explained in the previous post, NetworkMiner and Suricata are a great combination for performing quick and straightforward network forensics on captured traffic.
Table of Contents
Overview
NetworkMiner provides a comprehensive overview on what is going on in a network capture, while Suricata is scrutinizing every packet to find signs of potentially malicious activities. While I usually start with NetworkMiner, you can of course also run NetworkMiner and Suricata in parallel or start with Suricata first. However, Suricata might create a long list of findings and before getting lost in these details, I find it useful to have some understanding of what is actually going on from a bird’s-eye view.
Also remember that parsing pcap files that come from untrusted sources or that contain potentially malicious content should always be parsed in a safe virtual environment. Since the parsing engines in pcap readers need to support a large number of protocols, they are prone to exploits – so please have a look into my virtual lab guide, if in doubt.
When to use NetworkMiner & Suricata – and when not
After we set up NetworkMiner and Suricata in the previous post, I would like to show an easy example on how you can effectively use these tools in combination. I am using a blog post from Palo Alto’s Unit42 as basis for this explanation. What you can see in that post is that Wireshark is indeed a very versatile tool that can certainly be used for threat hunting. But then again, you need to understand how to use filters, you need to understand network traffic in detail, and if you don’t know what you are looking for, the malicious traffic might be right in front of your eyes – just to you it will look simply as “yet another packet”.
Don’t get me wrong: I think the Unit42 post is really good. Also, if you are already suspecting that a pcap file contains traces of malware, but no known indicators of compromise are available, diving deep with Wireshark is a good idea. After all, rule-based systems like Suricata can only detect malware if someone did the work of finding unique indicators of compromise and building a rule based on these.
In the following we will be analyzing files that contain Trickbot and Emotet traffic, two malware strains which are well understood and for which we can rely on existing rules.
Analyzing Emotet + Trickbot
First we will download a pcap file that contains traffic showing how Emotet and Trickbot “interoperate” to infect a system. The file in question – provided by malware-traffic-analysis.net – is called 2019-09-25-Emotet-infection-with-Trickbot-in-AD-environment.pcap.zip. The password to unzip the file is infected.
NetworkMiner
Let’s open that file in NetworkMiner. The tool will extract all artifacts (observed files etc.) from the pcap and save them on your harddisk – so once again: Only perform this kind of analyses in a safe virtual machine.
The first steps in NetworkMiner should not be too hard thanks to the graphical user interface, but I still recommend to have a look at the NetworkMiner homepage for short tutorials and other resources.
Hosts
Let’s see what we can see immediately without even switching tabs in NetworkMiner and staying in the Hosts tab:
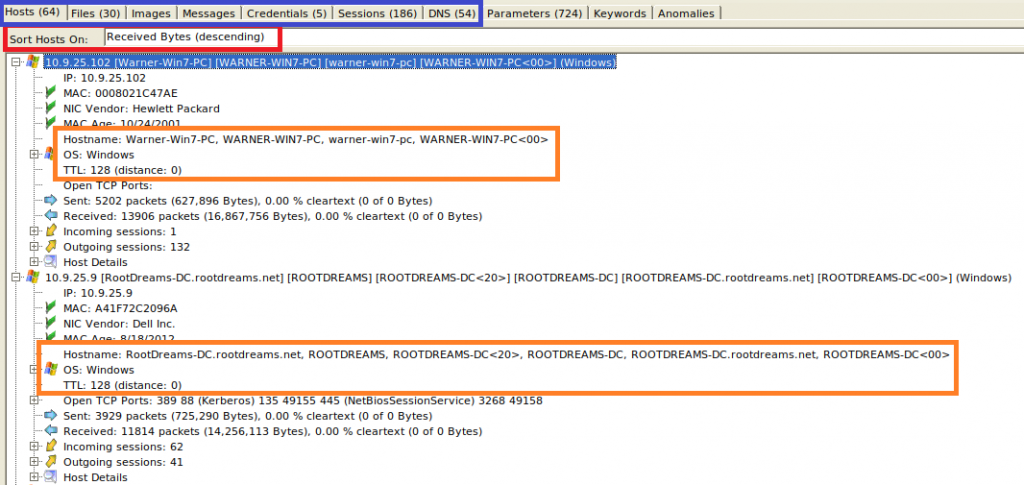
I sorted by the amount of Received Bytes (red box) to have these hosts on top, which received most data. This is simply because I know that the pcap focuses on malware traffic and so I’m assuming that traffic from the affected machines could make up most of the captured data. This however can of course be very different in a “raw” capture that was not specifically prepared and that might contain large amounts of “normal” traffic that would then appear on top.
The numbers in the tabs (blue box) show us that in this capture, there are 64 hosts involved that communicated in 186 sessions, transferred 30 files, and making 54 DNS lookups. Also, 5 credentials were observed. Seeing all this in Wireshark would have cost us quite a few searches! Especially the DNS lookups often come in handy because malware tends to communicate to external sites which at some point are known to be malicious – so you just have to look out for such connection attempts.
The two orange boxes show us that the two systems that received most traffic are “Warner-Win7-PC” (i.e. most likely a workstation running Windows 7), and “ROOTDREAMS-DC” (i.e. probably a Domain Controller). Both are shown as Windows OS, and so it is not surprising that the Time-to-Live (TTL) of the packets is 128, because this is the default TTL used by Windows (Linux would usually be somewhere around 64). Also, since the TTL is still at the initial value of 128 and not for example at 127, we can see that the capture was taken in the same subnet as these two machines are located. That’s also the reason why NetworkMiner shows “distance: 0”. We can of course still see much more in that first tab of NetworkMiner, but we are happy with that information for now.
Files
Moving on to the files tab, we can see all observed file transfers. If you click on the “Frame nr.” column, it will be sorted chronologically. This means, the file that was transferred first, appears on top. If you scroll a bit right, you can also see the real time stamps.
What we can see is that “Warner-Win7-PC” received most files (not surprisingly, because it appeared also on top as the system receiving most data):
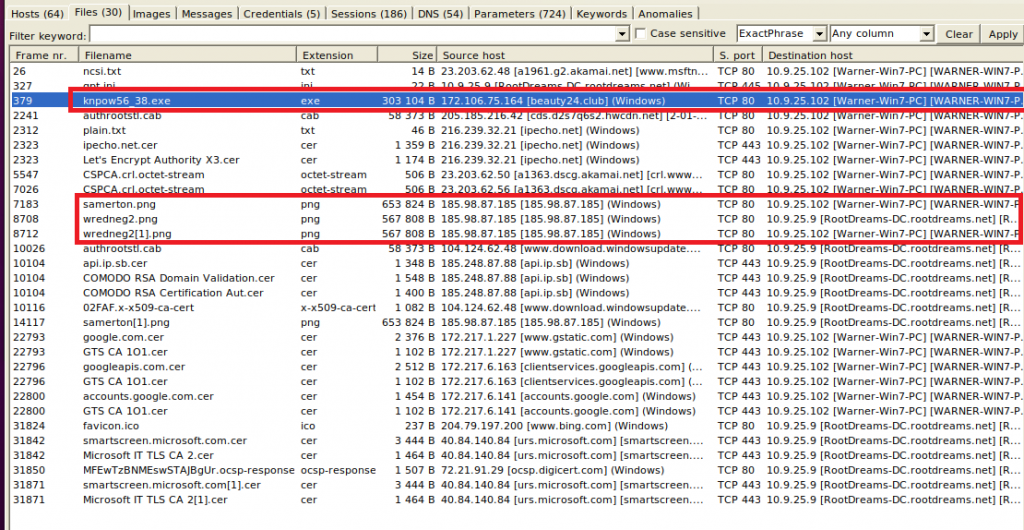
If you look at the source host, most domains look quite trustworthy (google.com, bing.com, microsoft.com), but there are some lesser known sites as well, e.g. beauty24[.]club. Also, the public IP 185.98.87[.]185 appears several times and serves png files to Warner and the domain controller. Maybe we can have a look at these images later. In every case it will be a good idea to let NetworkMiner calculate the hashes (right-click on a file > Calculate […] hash) and check these against VirusTotal’s database. Since quite a few files are shown in this pcap, we will wait for this manual task until we have a better idea about which files to check.
Sessions
The sessions tab gives as a very good overview on who was communicating with whom. We can immediately see that most of the communication took place between Warner and the DC:
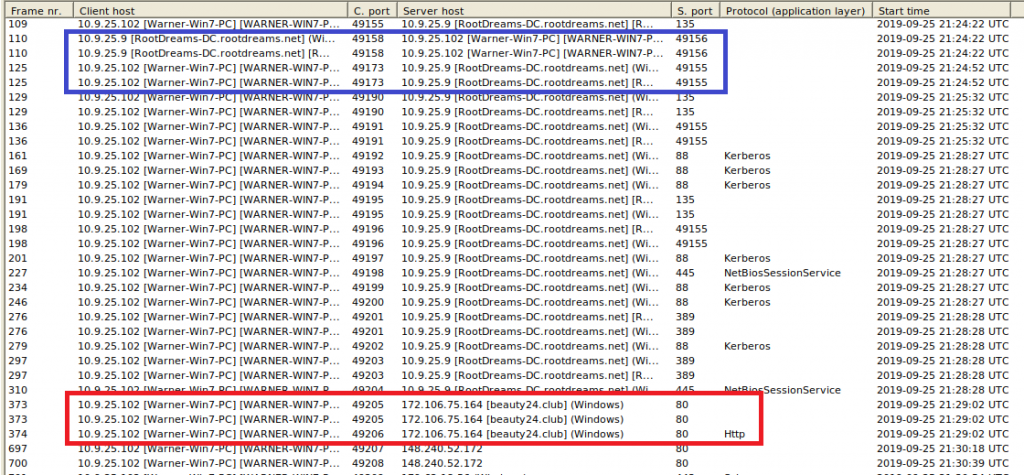
Most communication is immediately identifiable as “normal” DC traffic, e.g. port 88 for Kerberos, 389 for LDAP, or 135 for general Windows Remote Procedure Calls. What catches the eye is the high port-to-high port communication in the blue box – usually you would want to see high port (dynamic port) to low port (registered port). However, the range of 49155 and above just confirms that RootDreams-DC is indeed a domain controller, because for client-to-DC communication, these otherwise “unusual” ports are also normal.
DNS
Information that you see in the DNS tab is a good candidate to be checked against online Threat Intelligence platforms, such as VirusTotal or X-Force Exchange. If a system looks up a target that is known to serve malicious contents or to be a Command-and-Control IP, there is a good chance that the source of the request is infected.
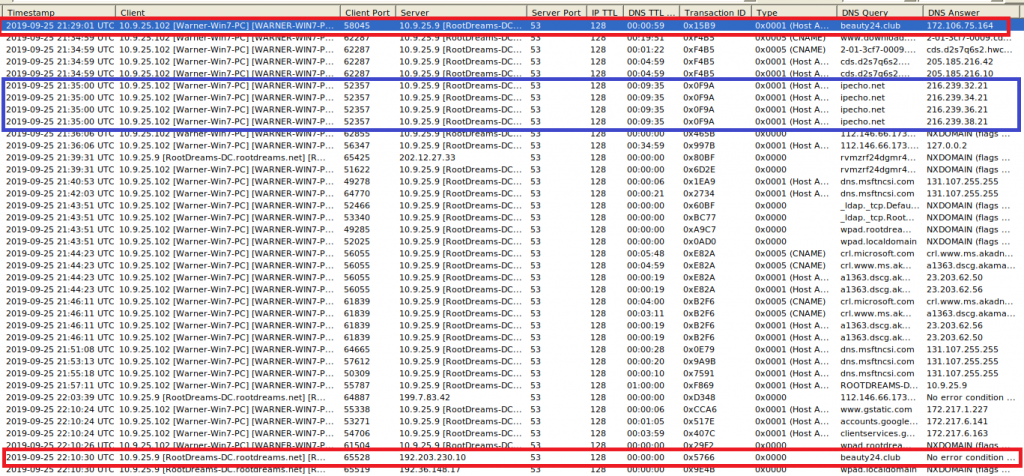
What we can see is that the unknown beauty[.]club domain was queried twice, in both cases by Warner, using the DC as DNS resolver: At first a valid IP address was returned, but 40 minutes later there is no response: SERVFAIL. This could be a sign that an ongoing attack failed to use the Fast Flux technique to quickly change DNS records, but of course it can have many harmless reasons, too. What I marked in the blue box is the request for ipecho[.]net. It is not rated malicious on VirusTotal and the like, but a quick verification shows that this site displays the public IP address of the system. Such lookups are not inherently malicious, but they can help malware to send that information to a controlling counterpart across the web, so that the machine will be remotely attacked or accessed.
Anomalies
Don’t forget to also check the “Anomalies” tab in NetworkMiner, which might already give some very strong indicators on what is happening:
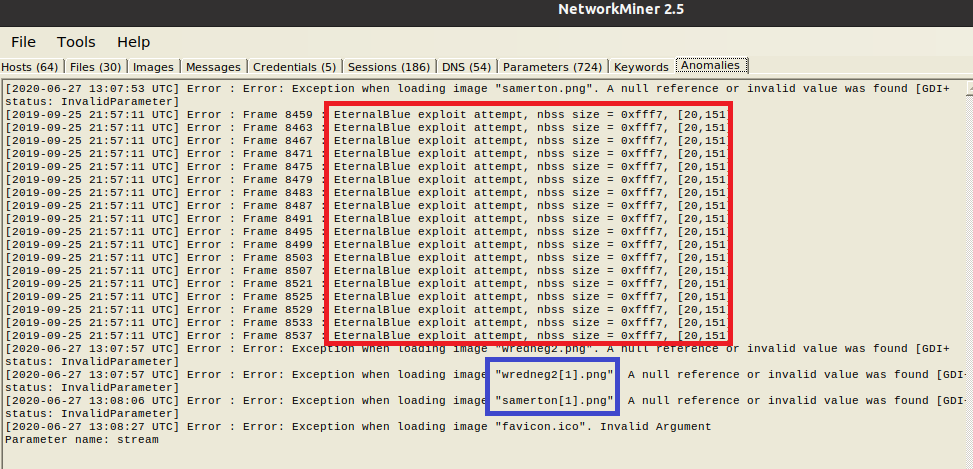
As the article by Palo Alto’s Unit42 describes, Trickbot hides downloads of executables as “image downloads”, while Emotet is trying to spread via well-known exploit “EternalBlue“. You could spot both in Wireshark, using the right filters and having the knowledge to spot traces (as done in that article) – or you have a look at the “Anomalies” tab in NetworkMiner: The EternalBlue exploit is immediately spotted, also the “image downloads” are apparently bogus, as we had already suspected before. In the File tab, you can right-click on one of the “image” files, calculate the hash and check it against VirusTotal:
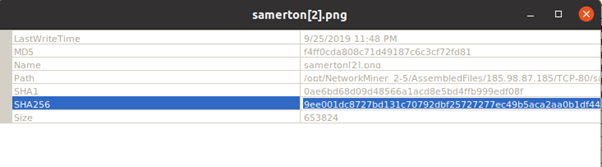
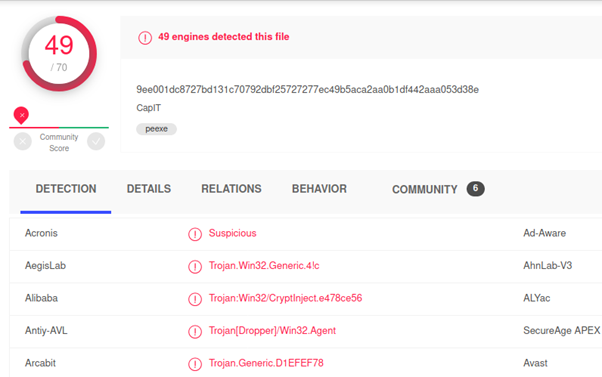
Our first hunch, that something was wrong with the images proved to be true. Of course, instead of first getting the overview like we did above, you could also immediately jump to the “Anomalies” tab. However, I find it useful to first understand what we are actually looking at, before jumping to any conclusions.
Suricata
While Suricata is a tad harder to set up than NetworkMiner, its usage is in fact really simple. Since it does not only work as IDS on live traffic, but also lets you inspect recorded traffic retrospectively, it is a great companion with other tools like Wireshark or NetworkMiner. When you are done with the first overview in NetworkMiner, you can let Suricata throw its abundant ruleset against the pcap, using the following command:
sudo suricata -c /etc/suricata/suricata.yaml -r *path to your pcap file*.pcapResults in fast.log
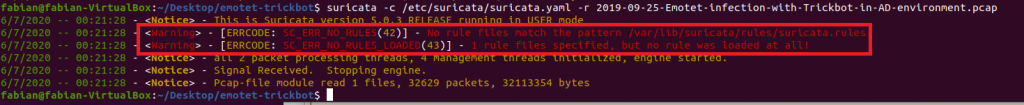
The results – and any findings – will be written to “fast.log” in your current directory. None of the findings will be visible directly from the CLI, but what you should make sure is that indeed rules were loaded. If Suricata states that no rules were applied, it might be that you had not installed any, or that Suricata does not have enough rights to access the rules folder. This is how it should look like:

And this is when Suricata could not analyze the pcap due to missing / inaccessible rules:
Emotet traffic starting after download of Exe
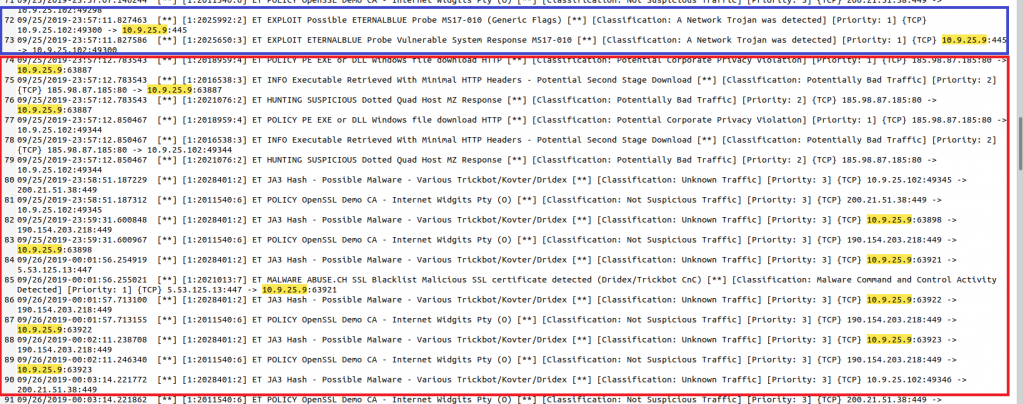
Right at the top of the Suricata log, we can see that an Exe file is downloaded and immediately after, malicious traffic starts over port 443 and 449:

In NetworkMiner we can also check which Exe file was downloaded. We can use the dynamic port used in that connection, as shown by Suricata, to identify the connection in NetworkMiner more quickly:
172.106.75[.]164:80 -> 10.9.25.102:49206

We can see, that knpow56_38.exe was downloaded from beauty24[.]club and this was the trigger for all the remaining malicious activites. Let’s check the file hash against VirusTotal:
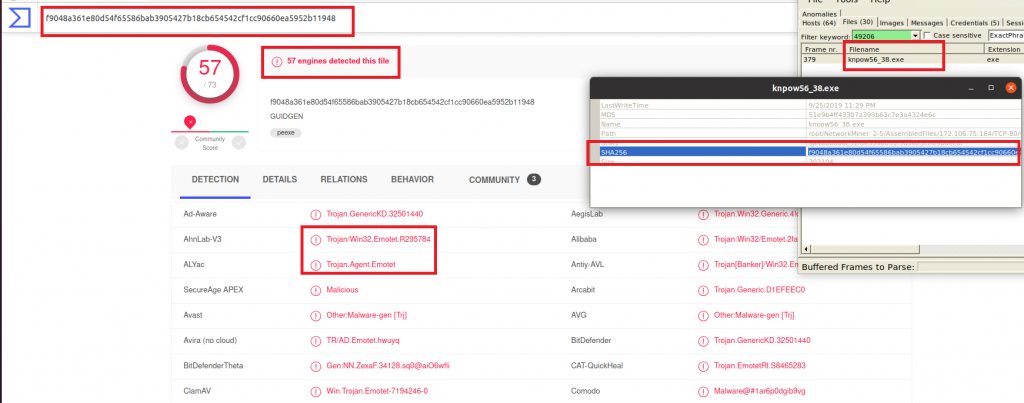
Welcome Emotet…
By the way, we found this out by just looking at the first lines of the Suricata log and the NetworkMiner analysis. The analysis in the Unit42 article is somewhat more complex, so for an easy start, I would not necessarily jump right in with Wireshark. Understanding packets on the lowest level – and not just a generated analysis – is of course still of high value, especially if no clear IoCs are known yet.
Also for some findings that are not clear in NetworkMiner and Suricata a closer look into Wireshark can help, for example to understand why Suricata alerts on “POLICY OpenSSL Demo CA – Internet Widgits Pty (O) [**] [Classification: Not Suspicious Traffic]”. Check the Unit42 article to understand why the employed certificate is indeed suspicious.
Trickbot loaded by Emotet
Emotet often loads Trickbot to spread across the network. This is also exactly what we see here: Traffic on port 443 observed above still belongs to Emotet, the connection via port 449 is then classified as possible Trickbot traffic by Suricata:

This is very much in line with descriptions that explain how Trickbot works.
EternalBlue Exploit
So we saw that Emotet loaded Trickbot. The latter often exploits EternalBlue vulnerabilities to spread to domain controllers. We know from NetworkMiner that the domain controller IP is 10.9.25.9. Let’s check what we find for the DC in the Suricata log:
Sure enough, there is an EternalBlue exploit and right after that, the DC shows the same behaviour like the “Warner” PC before. Since the domain controller was vulnerable to EternalBlue, it downloaded Trickbot itself and is now also infected. I used again the dynamic port seen in the Suricata log to quickly find the file in NetworkMiner:
Download of obfuscated executables
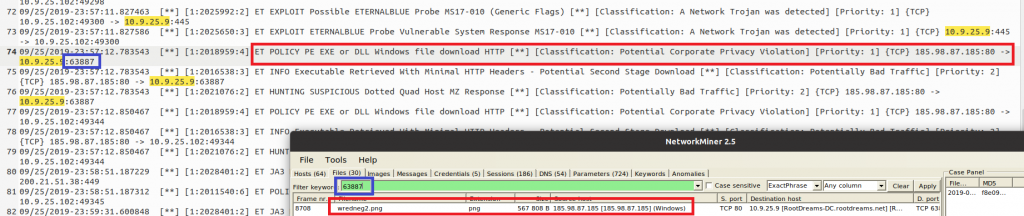
Interestingly, Suricata alerts on the download of an executable, but the file appears to be an image (ending in “.png”). Further upstream we can also see that Suricata analyzed the unencrypted HTTP connection between 185.98.87[.]185 and 10.9.25.102 and discovered another download of a “PE EXE or DLL Windows file” for WARNER PC:

In NetworkMiner, also this connection showed the download of a “png” image file:

We were already suspicious without Suricata, because in “Anomalies”, NetworkMiner complained that the file does not seem to be a valid image; checking it against VirusTotal (VT) showed us that indeed it is a virus. If we had not seen this in Anomalies and checked against VT, Suricata would have given us another hint here.
Taking care of timezones
By the way, if you compare the timestamps in NetworkMiner and Suricata you will notice that the same action is shown two hours later in NetworkMiner. This is for the simple reason that Suricata converts the pcap timestamps to the local timezone, which for me is two hours ahead of UTC, which is used by NetworkMiner.
Encrypted traffic on non-standard ports
There are also some details on which Suricata alerts, but we are unable to find much more meaningful information in NetworkMiner. For example, the session which in NetworkMiner is simply shown as a connection over (the rather unusual) port 447…
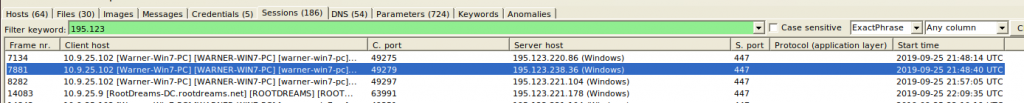
… is further described in Suricata:

We can see that indeed an encrypted connection was built up, using port 447 instead of TLS default port 443. This is a known technique of Trickbot to communicate with its command and control network. If we wanted to know more about the underlying details, again we would need to use Wireshark.
Nevertheless, I hope this tutorial showed how to effectively employ NetworkMiner and Suricata to quickly identify malware traffic. Both tools are easy to use and are a really good companion in settings where time is very limited and where we need to get as quickly as possible a good understanding of what’s going on in our network.